

Standard Proctor test (ASTM D698): procedure and calculation
How to run the standard Proctor test (ASTM D698), Methods A, B and C, and read the optimum moisture content and maximum dry density from the curve.
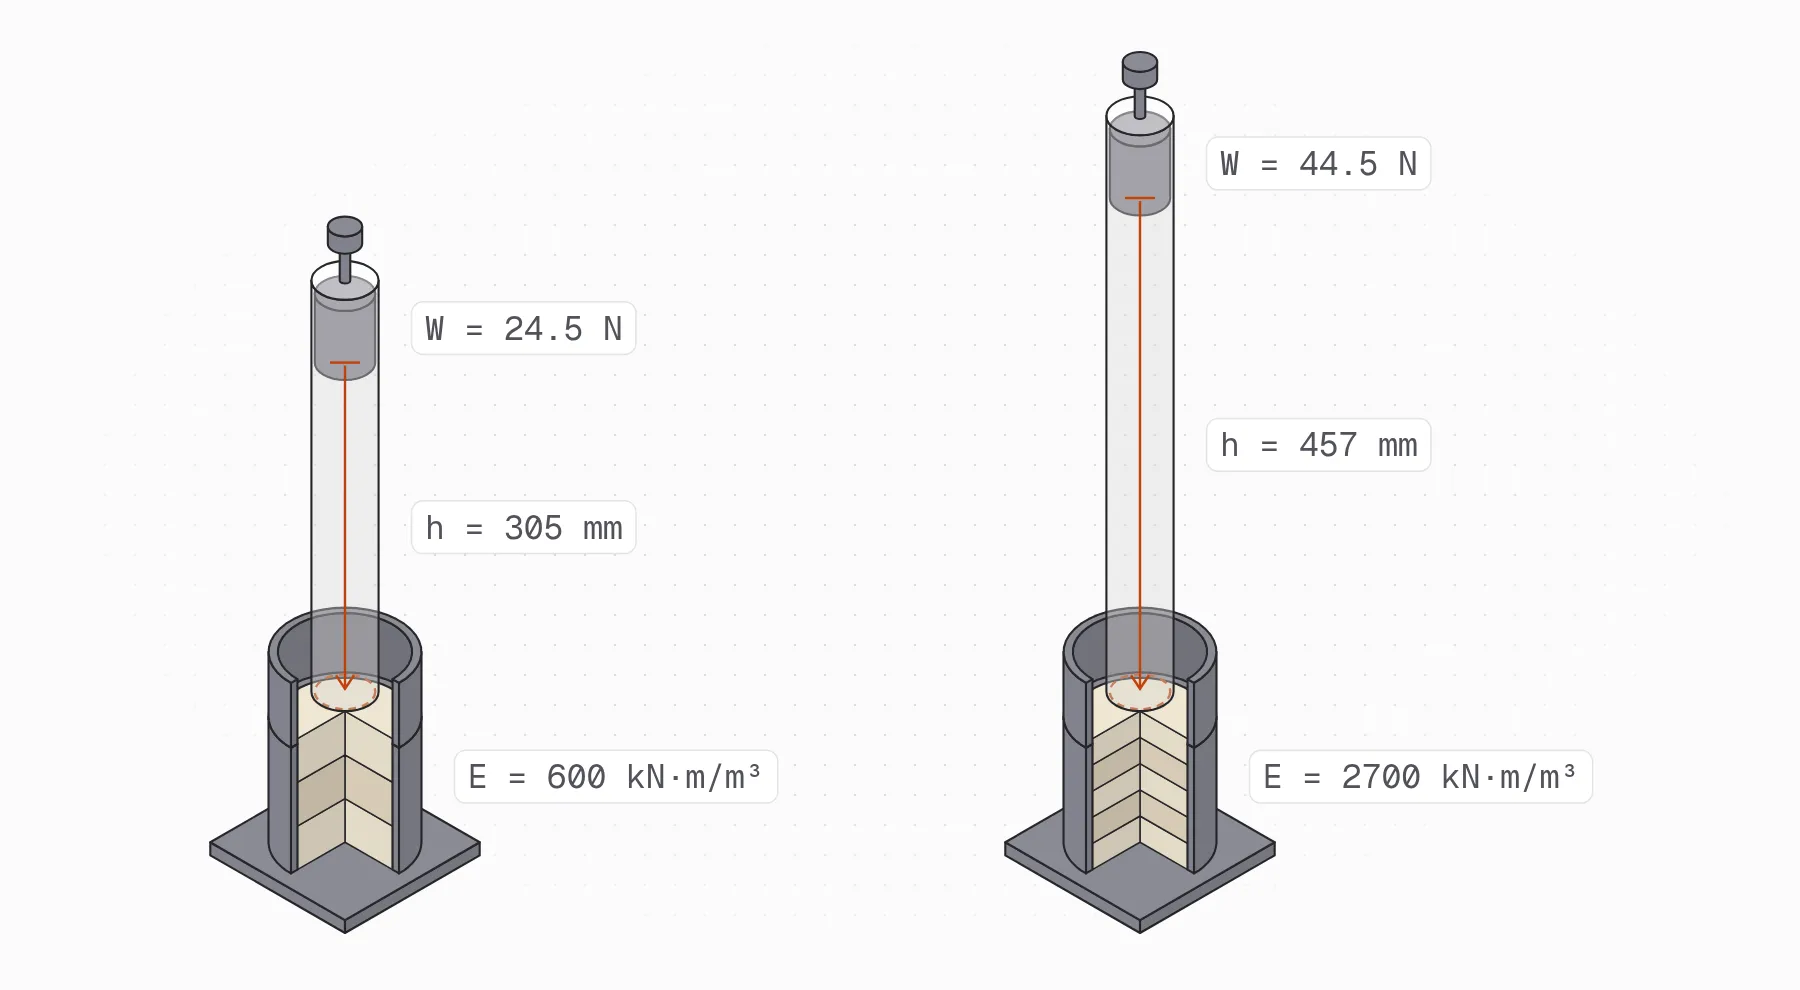
The Proctor test measures how dense a soil gets under a fixed compaction effort, and at what water content it gets there. Its two results, the maximum dry density and the optimum moisture content, are the targets that an embankment, a road base or a building pad is compacted to and checked against in the field. This lesson follows ASTM D698, the standard Proctor test: the soil is compacted in a mold, in three layers, with a 24.5 N (5.5 lbf) rammer dropped 305 mm (12 in), for an effort of 600 kN·m/m³ (12,400 ft·lbf/ft³).
The method goes back to Ralph R. Proctor, who published it in Engineering News-Record in 1933. ASTM D698 keeps his equipment and procedure with one change: Proctor applied his blows as firm 12-inch strokes, while the standard lets the rammer fall freely, so that the effort no longer depends on the operator.
Standard and modified Proctor compaction calculator
Calculator · ASTM D698 · D1557 · D4718
Compaction trials
One trial per water content, in increasing order. The mass is the mold's with its base and the compacted soil.
| Trial | Water content(%) | Mold with its base and the soil(kg) |
|---|---|---|
| #1 | ||
| #2 | ||
| #3 | ||
| #4 | ||
| #5 | ||
| #6 | ||
| #7 | ||
| #8 |
The standard asks for at least four trials, two on each side of the optimum. If the optimum falls at the edge, that side is short of trials.
Mold
The volume comes from its size, and it's the denominator of every density. A 4-inch mold holds about 944 cm³; the calculation takes what you measure, not a catalog value.
Soil and water
The specific gravity draws the 100 % saturation line, the test's physical limit. The water's density is the one at the laboratory's temperature.
Oversize particles (ASTM D4718)
Optional. If more than 5 % of the dry mass was retained on the method's sieve and left out of the test, enter that percentage: the calculator corrects the optimum and the maximum density to the total material. The correction holds up to 30 %.
Of the total dry mass. Empty, no correction.
Only with oversize.
Only with oversize.
- Trials
- 100 % saturation
8 compaction trials, 4 before the optimum and 4 after. The curve through the densest trial and its two neighbours peaks at 9.5 % water content, with 1899 kg/m³ of dry density: that's the test's optimum and maximum density
The test's result
| Quantity | Value |
|---|---|
| Mold volume(D/2)² · π · H | 919.8cm³ |
| Optimum water content · woptthe peak of the curve through the densest trial and its neighbours | 9.5% |
| Maximum dry density · ρd,maxthe same peak, without the water | 1899kg/m³ |
| Maximum dry unit weight · γd,maxg · ρd,max, to the nearest 0.02 | 18.62kN/m³ |
| Degree of saturation at the optimum · Sw · Gs / (Gs · ρw / ρd − 1) | 64% |
This calculator is offered for information and technical support. It doesn't replace professional judgment or the reviews due, and its use is the user's responsibility.
The calculator also has a page of its own, to keep at hand: the Proctor test calculator. How a fill’s compaction is specified and checked on site is in the guide to soil compaction.
What is the Proctor test?
The Proctor test is a laboratory compaction test. You compact several portions of the same soil, each at a different water content, with the same energy, and measure the dry density each one reaches. Plotted against water content, those points form the compaction curve.
The curve rises, peaks and falls. On the dry side, adding water lets the particles slide past each other under the blows, so the same energy packs them tighter. Past the peak, the extra water takes up space in the pores that the soil particles could otherwise fill, and the dry density drops. The peak gives the two results of the test: its water content is the optimum moisture content (), and its dry density is the maximum dry density (), or maximum dry unit weight () when it is expressed as a weight.
Both results depend on the compaction energy, so a field specification names the test, standard or modified, and asks for a share of its maximum dry density, such as 95 %, at a water content near the optimum.
Standard and modified Proctor
The modified Proctor test, ASTM D1557, uses the same molds and the same three methods, but a heavier rammer, a longer drop and more layers. It applies about 4.5 times the energy of the standard test, so it gives a higher maximum dry density at a lower optimum moisture content.
| Standard Proctor (ASTM D698) | Modified Proctor (ASTM D1557) | |
|---|---|---|
| Rammer | 24.5 N (5.5 lbf) | 44.5 N (10 lbf) |
| Drop | 305 mm (12 in) | 457 mm (18 in) |
| Layers | 3 | 5 |
| Blows per layer | 25 (4-in mold) or 56 (6-in mold) | 25 (4-in mold) or 56 (6-in mold) |
| Compactive effort | 600 kN·m/m³ (12,400 ft·lbf/ft³) | 2,700 kN·m/m³ (56,000 ft·lbf/ft³) |
Compaction test methods A, B and C (ASTM D698)
ASTM D698 has three methods. The specification for the material sets which one to use; if it doesn’t, the gradation of the soil decides, from the share retained on each sieve (see the sieve analysis lesson).
| Method | Mold | Soil used | Layers | Blows per layer | Use when |
|---|---|---|---|---|---|
| A | 101.6 mm (4 in) | Passing the No. 4 sieve (4.75 mm) | 3 | 25 | 25 % or less is retained on the No. 4 sieve |
| B | 101.6 mm (4 in) | Passing the 3/8-in sieve (9.5 mm) | 3 | 25 | 25 % or less is retained on the 3/8-in sieve |
| C | 152.4 mm (6 in) | Passing the 3/4-in sieve (19.0 mm) | 3 | 56 | 30 % or less is retained on the 3/4-in sieve |
If a soil doesn’t meet the gradation limit of Method A or B, use Method C. The 6-in mold is never used with Methods A or B. ASTM D698 covers only soils with 30 % or less retained on the 3/4-in sieve, and only soil that hasn’t been compacted in the laboratory before.
The 6-in mold takes 56 blows instead of 25 so that both molds receive about the same energy per unit volume. The effort is the work of all the blows divided by the volume of the mold:
Where:
- : compactive effort (ft·lbf/ft³ or kN·m/m³)
- : blows per layer
- : number of layers
- : weight of the rammer (5.5 lbf, 24.5 N)
- : drop height (1 ft, 0.305 m)
- : volume of the mold (1/30 ft³ for the 4-in mold, 1/13.33 ft³ for the 6-in mold)
For the 4-in mold, ft·lbf/ft³; for the 6-in mold, ft·lbf/ft³. Both round to the 12,400 ft·lbf/ft³ of the standard. Results still differ a little between molds: at the same effort, the smaller mold tends to give slightly higher densities.
Equipment
-
Mold assembly, of rigid metal, with a base plate and an extension collar that attach and detach easily. The walls may be solid, split or tapered.
- 4-in mold: inside diameter 101.6 ± 0.4 mm (4.000 ± 0.016 in), height 116.4 ± 0.5 mm (4.584 ± 0.018 in), volume about 944 cm³ (1/30 ft³).
- 6-in mold: inside diameter 152.4 ± 0.7 mm (6.000 ± 0.026 in), same height, volume about 2,124 cm³ (1/13.33 ft³).
Calibrate the volume of your own mold, by filling it with water or from its measured dimensions, and use that value in the calculations instead of the nominal one.
-
Rammer with a mass of 2.495 ± 0.023 kg (a weight of 24.47 ± 0.09 N, or 5.50 ± 0.02 lbf) that falls freely 304.8 ± 1 mm (12.00 ± 0.05 in) onto the soil, with a flat circular face 50.8 mm (2 in) in diameter. A manual rammer runs inside a guide sleeve with vent holes near each end, so air can escape as the rammer falls. A mechanical rammer may replace it if it is calibrated according to ASTM D2168; with the 6-in mold it normally uses a sector-shaped face.
-
Rigid foundation: a concrete block or cylinder of at least 91 kg (200 lb), or a concrete floor. The mold must sit on it without rocking, with the base plate fastened to it.
-
Balance readable to 1 g for the mold with the soil, and a more sensitive one for the water content samples, as ASTM D2216 requires.
-
Drying oven that holds 110 ± 5 °C.
-
Straightedge: stiff metal, at least 250 mm (10 in) long, with the scraping edge beveled if it is thicker than 3 mm.
-
Sieves: 19.0 mm (3/4 in), 9.5 mm (3/8 in) and 4.75 mm (No. 4).
-
Caliper, to measure the mold if its volume is found from its dimensions.
-
Sample extruder (optional): a jack with a frame, to push the specimen out of the mold.
-
Mixing tools: pan, trowel, spatula, a spray bottle to add water evenly, and containers with lids for the soil to stand in.
Procedure (ASTM D698)
Preparing the soil
-
Choose Method A, B or C, as the specification asks or from the gradation.
-
Process the soil over the method’s sieve. The standard prefers to do it without drying the sample first; if the soil is too wet to break up, air-dry it until it crumbles, breaking up the lumps without crushing the particles. Record the mass of the soil that passes (the test fraction) and of the soil retained (the oversize fraction), and their water contents, so you can work out the percentage of each later.
-
From the test fraction, prepare at least four, and preferably five, portions (subspecimens) with water contents that bracket the optimum. Make the first one close to the estimated optimum, then at least two drier and two wetter, about 2 % apart. A soil with a very high optimum or a flat curve may need larger steps. Each portion is about 2.3 kg for Methods A and B; Method C needs considerably more.
With some practice you can judge a point near optimum by hand: a cohesive soil squeezed in the fist holds together as a lump and breaks cleanly when you bend it. Drier, it crumbles; wetter, it sticks together as a sticky mass.
-
Spray the water into each portion while mixing, until it is evenly distributed, and seal it in a covered container to stand before compaction. The minimum standing time depends on the soil’s group in the USCS:
Soil Minimum standing time GW, GP, SW, SP None GM, SM 3 h All other soils 16 h -
Use fresh soil for every point. Soil that has already been compacted in the laboratory gives a higher maximum dry density, so the standard doesn’t allow you to reuse it.
Compacting each point
-
Record the mass of the mold, with the base plate if you’ll leave it attached.
-
Assemble the mold, the base plate and the collar, and check that the inside of the collar lines up with the mold. Set it on the rigid foundation, without rocking, and fasten the base plate.
-
Place loose soil for the first layer, spread it evenly and tamp it lightly, with the rammer or a tamper about 50 mm (2 in) across, until it is no longer fluffy.
-
Compact the layer with 25 blows in the 4-in mold or 56 blows in the 6-in mold. Hold the guide sleeve steady and vertical, don’t lift it as you raise the rammer, and apply the blows at a steady rate so they cover the whole surface evenly, following the standard’s pattern.
-
After each of the first two layers, trim off the soil that stayed loose against the mold walls or above the compacted surface, and discard it.
-
Compact the second and third layers the same way, so that the three end up about the same thickness. The third layer must reach slightly into the collar, but no more than about 6 mm (1/4 in) above the top of the mold. If it ends higher than that, or below the top of the mold, discard the point and compact it again with fresh soil.
Trimming, weighing and water content
-
Remove the collar. Run a knife around the inside of the collar and rotate it before lifting, so the soil below the top of the mold doesn’t tear. Remove the base plate too, unless the soil is so wet or so dry that it would fall out; in that case the mold’s volume must be calibrated with the base plate attached.
-
Trim the specimen flush with the top of the mold by scraping the straightedge across it. Fill any holes with leftover soil, pressed in with your fingers, and scrape again. Trim or remove gravel particles that stick out, so that what sticks out and the holes left balance each other. If the mold’s volume was calibrated without the base plate, trim the bottom of the specimen too.
-
Weigh the mold with the specimen (and the base plate, if attached) to the nearest gram.
-
Push the specimen out of the mold and determine its water content according to ASTM D2216. Drying the whole specimen is preferred; otherwise take a representative portion that cuts through all three layers, of at least 100 g for Method A, 500 g for Method B or 2.5 kg for Method C.
-
Once every point is compacted, check that the wet densities rise to a peak and fall again, with points on both sides of it. If they don’t, compact more points.
Calculations: dry density, optimum moisture content and maximum dry density
-
Volume of the mold. Use the calibrated volume. From the dimensions it is
where is the average inside diameter and the height of the mold.
-
Moist (total) density of each point:
where is the mass of the mold with the compacted soil and the mass of the mold (both with the base plate if it stayed attached).
-
Molding water content of each point, from the soil taken after compaction, never from the amount of water you meant to add:
where is the mass of water lost in the oven and the oven-dry mass of the soil. Report it to the nearest 0.1 %.
-
Dry density of each point:
The standard reports dry unit weight: , which gives kN/m³ when you multiply in kg/m³ by 0.0098066, or lbf/ft³ when you multiply it by 0.062428.
-
Compaction curve. Plot the dry density (or dry unit weight) of each point against its water content, and draw a smooth curve through the points. Read the peak: the optimum moisture content, to the nearest 0.1 %, and the maximum dry unit weight, to the nearest 0.02 kN/m³ (0.1 lbf/ft³). Keep the same scales between tests so curves of different soils can be compared.
The calculator above reads the peak the same way: it fits a parabola through the densest point and its two neighbors and takes its vertex, which usually falls between two points. If the densest point is the driest or the wettest, there’s no curve past it, so it reports that point and asks for more trials on that side.
-
Zero-air-voids curve. Plot the 100 % saturation curve on the same graph, using the specific gravity of the soil, measured with the specific gravity test or estimated from the same soil type and source. At each water content, the dry density with every pore full of water is
ASTM D698 writes it the other way round, as the water content that saturates the soil at a given dry density:
The degree of saturation of any compaction point follows from the phase relations:
Where is the density of water and the degree of saturation (%). No compaction point can lie to the right of this curve.
-
Oversize correction (ASTM D4718). If more than 5 % of the dry mass was retained on the method’s sieve and left out of the test, correct the results to the total material. First the percentages of oversize and finer fractions, by dry mass:
Then the corrected water content and dry density:
Where:
- , : dry masses of the oversize and finer fractions
- , : percentages of oversize and finer fractions (%)
- : water content of the finer fraction, the optimum from the test (%)
- : water content of the oversize fraction (%)
- : dry density of the finer fraction, the maximum from the test
- : bulk specific gravity of the oversize particles
- , : corrected water content and dry density of the total material
ASTM D4718 holds for up to 30 % of the material retained on the 3/4-in sieve. The correction can also go the other way, applied to the field density test instead of to the laboratory results.
Reading the compaction curve
On the wet side of the optimum, the compaction curve runs close to the shape of the zero-air-voids curve, a little below it. On the dry side it may be flat or uneven, especially in free-draining soils. In cohesive soils the optimum moisture content usually falls slightly below the plastic limit; in clean sands and gravels it is close to zero or near the point where water starts to drain out of the mold.
Common mistakes:
- Too few points, or all on one side. With fewer than four points, or fewer than two on each side of the peak, the optimum depends on how the curve is drawn. If the densest point is the driest or the wettest, compact more points beyond it.
- A point to the right of the zero-air-voids curve. That is physically impossible: check the specific gravity, the masses, the mold volume and the calculations.
- Reusing compacted soil. It gives a maximum dry density higher than the soil’s.
- Using the target water content instead of the one measured on the compacted specimen.
- Using the nominal mold volume instead of the calibrated one.
- Testing free-draining sands and gravels. The test may not give a well-defined peak, and its maximum can come out lower than the maximum index density from ASTM D4253.
- Testing soils whose particles break under the rammer. The laboratory then reaches densities that the field can’t.
- Testing a soil with more than 30 % retained on the 3/4-in sieve. That material is outside ASTM D698, and replacing the oversize with finer soil doesn’t give a valid maximum. One option the standard describes is a test fill followed by a method specification (equipment, lift thickness, water content range and number of passes).
Report
- Method used (A, B or C) and preparation method (moist or dry).
- Type of rammer (manual or mechanical).
- Description and classification of the soil, and the sample’s identification (project, location, depth).
- The sieve data used to choose the method, and the percentages retained and passing that sieve.
- Specific gravity used, and how it was obtained.
- Optimum moisture content, to the nearest 0.1 %, and maximum dry unit weight, to the nearest 0.02 kN/m³ (0.1 lbf/ft³); if you applied the oversize correction, the corrected values as well.
- The compaction curve, with the points used to draw it, the 100 % saturation curve and the peak marked.
References
- ASTM International. ASTM D698-12(2021), Standard Test Methods for Laboratory Compaction Characteristics of Soil Using Standard Effort (12,400 ft-lbf/ft³ (600 kN-m/m³)). astm.org/d0698-12r21.html
- ASTM International. ASTM D1557-12(2021), Standard Test Methods for Laboratory Compaction Characteristics of Soil Using Modified Effort (56,000 ft-lbf/ft³ (2,700 kN-m/m³)). store.astm.org/d1557-12r21.html
- ASTM International. ASTM D4718/D4718M-15(2023), Standard Practice for Correction of Unit Weight and Water Content for Soils Containing Oversize Particles. astm.org/d4718_d4718m-15r23.html
- NICET (2020). Performance Examination, Soils: ASTM D698-12e2. nicet.org (PDF)
- Hossain, M. S., Islam, M. A., Badhon, F. F., & Imtiaz, T. (2021). Properties and Behavior of Soil: Online Lab Manual, chapter 6, “Compaction Test”. University of Texas at Arlington. uta.pressbooks.pub
- Washington State DOT (2026). Materials Manual M 46-01, WAQTC FOP for AASHTO T 99/T 180, Annex A: correction for oversize particles. wsdot.wa.gov (PDF)
- Germaine, J. T., & Germaine, A. V. (2009). Geotechnical Laboratory Measurements for Engineers. Wiley.